Over the past two decades, the divergence in electricity rates among U.S. states has grown increasingly stark. While in 2004 the average residential electricity rate in the five most expensive states was only twice as high as in the five most affordable states, today it is 2.6 times higher. This widening gap reflects the growing differences in state approaches to energy production, regulation, and climate policy, which have created distinct regional energy landscapes across the nation.
A key factor driving these divergences is the adoption of renewable energy mandates, carbon emission–reduction goals, and cap-and-trade schemes, primarily in states with Democratic leadership. States that have required renewables, particularly wind and solar energy, to be used in electricity production often experience higher electricity costs due to the regulatory burdens placed on traditional energy sources, such as natural gas and coal. For instance, several states have limited the construction of natural gas infrastructure or restricted access to abundant natural gas resources, exacerbating energy costs for their residents and their neighbors.
In contrast, many of the states with the most affordable electricity have avoided stringent renewable energy mandates and instead rely heavily on traditional energy sources. Texas and Ohio, both of which have significant natural gas reserves, benefit from relatively low electricity costs, though Texas’s push toward renewable energy has contributed to grid instability and higher operating costs. Similarly, hydroelectric power plays a major role in keeping electricity rates low in Washington State, whose mountains and rivers provide abundant, reliable hydropower.
Most emblematic of large states with sound energy policies is Florida. Despite its reputation, the Sunshine State is often cloudy and rainy, which means that its solar capacity factor is not as high as one might expect and significantly lower than in western states. What Florida has done instead is to take advantage of the shale boom to quickly expand its natural gas baseload capacity. Florida depends on natural gas for 76 percent of its power needs, more than the other large states. That is particularly ironic, because, of the five largest states, the other four (California, Texas, New York, and Pennsylvania) have substantial natural gas reserves, while Florida has none of its own. All of Florida’s natural gas is brought in by pipeline from other states.
Differences in state energy policies not only affect electricity prices but also the stability and reliability of the electric grid. The ongoing shift toward renewable energy, combined with federal policies that aim to reduce reliance on fossil fuels, has created challenges for grid operators nationwide. In regions governed by Regional Transmission Organizations (RTOs), where utilities cannot easily pass capital and operating costs onto consumers, rising capacity prices are putting additional strain on the system. These issues are further exacerbated by federal subsidies for solar energy producers, which flood the market during daylight hours but fail to provide continuous power, requiring backup from more stable energy sources like nuclear and natural gas.
With increasing demand for electricity, driven by factors such as the push for electric vehicles and the expansion of energy-intensive technologies, such as artificial intelligence (AI)-powered data centers, the U.S. electricity grid is facing a critical shortfall in generation capacity. According to industry experts, the country may see a 30 percent shortfall in capacity by 2032 unless significant changes are made to both policy and infrastructure.
The divergence in electricity rates among the states underscores the importance of carefully balancing environmental goals with the need for affordable and reliable energy. As states continue to navigate the complexities of energy policy, the consequences of their decisions will become increasingly evident, not only in the form of higher electricity prices but also in the reliability of the power grid itself.
If the current trajectory of federal and state energy policies continues, more states may face challenges in meeting electricity demand while keeping costs manageable. The broader implications for the U.S. economy, energy security, and the ability to transition to a cleaner energy future remain pressing concerns for policymakers nationwide.
Residential Electricity from State to State
Electricity prices vary greatly across states. While many factors influence electricity prices, a careful survey of the states shows a strong correlation between high electricity prices and progressive political control and progressive policies. As Table 1 demonstrates, those states that have Renewable Portfolio Standards (RPS) greater than 35 percent and are under Democratic Party political control have a high chance of being in the most expensive group of states for residential electricity.
Another factor is also important: Those states that transitioned away from vertically integrated utilities to RTOs starting in the late 1990s have also exposed themselves to significant problems because of the “open access” tariff system in RTO areas. That is because the interaction of renewable subsidies with the market structure of RTOs has proven remarkably toxic. In RTO areas, utilities must purchase whichever power is being sold most cheaply at any given time, and the capital and operating costs of power plants cannot easily be passed on to consumers. As a result, heavily subsidized solar and wind in the RTO areas are chilling investment in baseload generation (coal, natural gas, and nuclear power) which cannot easily recoup operating costs in competition with subsidized solar and wind power at different times during the day.
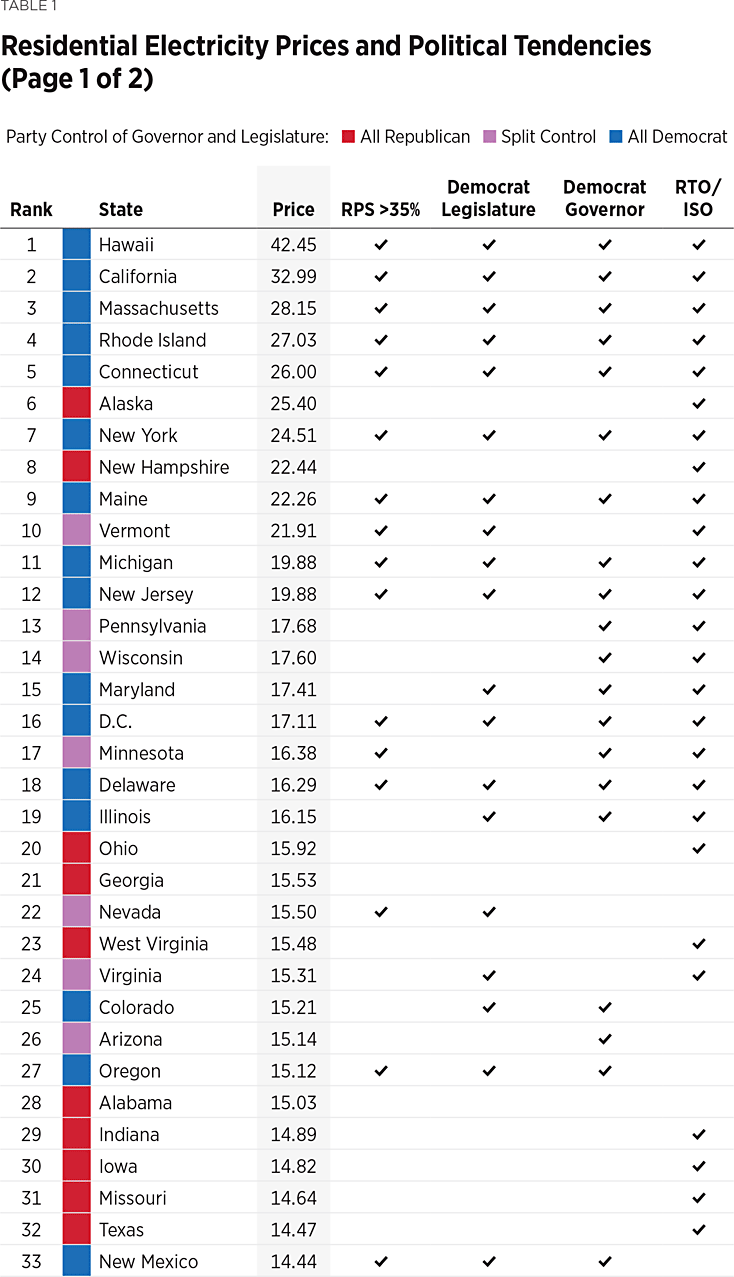
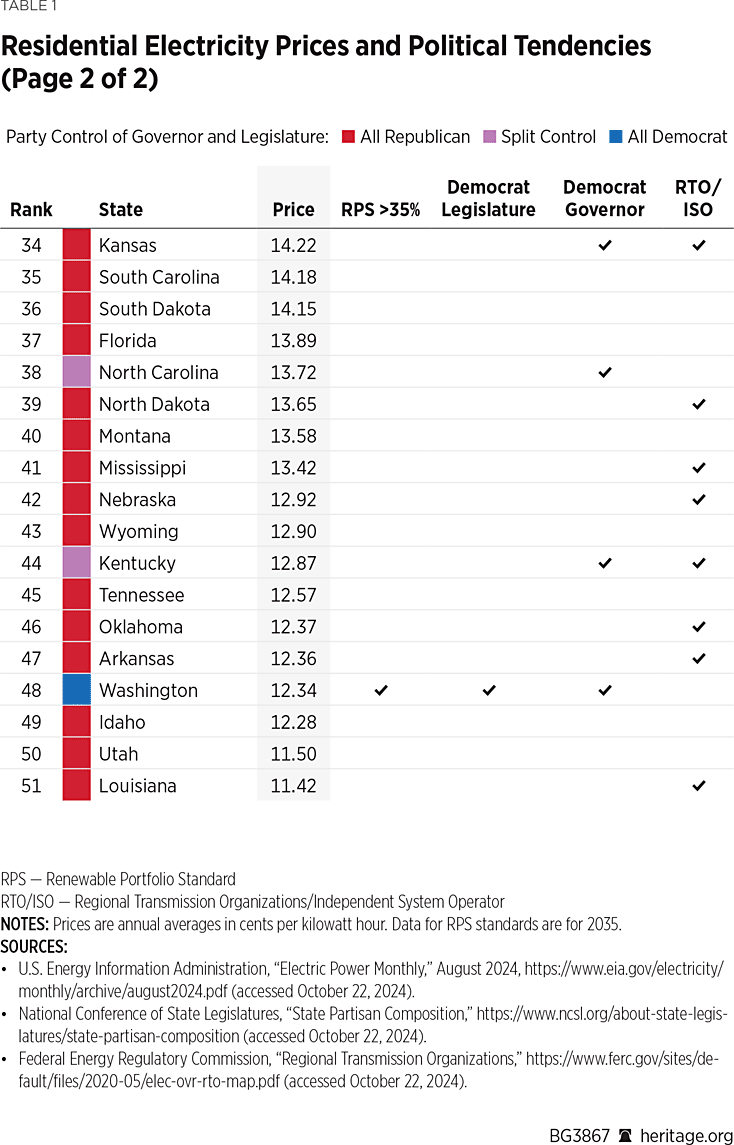
Misguided Climate Policies in Blue States Cause High Electricity Prices. Of the top 10 most expensive states for electricity, all but two are under Democratic political control. The two exceptions are Alaska and New Hampshire, and electricity prices in both states suffer from unfavorable geographic factors.
Alaska is cut off from U.S. energy supply by geography and by the Jones Act, and internal distribution of electricity in Alaska has additional challenges of scale and transmission distance.
New Hampshire is cut off from affordable energy by the state of New York, which has blocked new natural gas pipeline construction, thereby imposing exorbitant electricity prices on both its residents and residents of New England.
Of the top 10 most affordable states for electricity, there is only one progressive state, Washington, and it is also a geographic anomaly.
States with Low Electricity Prices and High Renewable Penetration Are Geographic Anomalies. For example, Washington’s mountains and rivers allowed the buildout of massive hydroelectric plant capacity. Washington’s hydroelectric plants now produce 25 percent of America’s total hydropower. In general, the windiest of the lower 48 contiguous states are the mountain and plains states east of the Rocky Mountains, from Montana and North Dakota to Texas. All those states have both abundant wind-power capacity and wind power that operates more reliably than elsewhere because of persistently windy conditions.
California Has Exorbitant Electricity Prices Because of, Not in Spite of, Renewable Penetration. At 30 percent of installed (“nameplate”) grid capacity, solar power provides an over-abundance of heavily subsidized electricity in the middle of the day, which drives down the price of electricity for all energy producers. That means that baseload generators must operate as a loss for those parts of the day, making it increasingly difficult for them to recoup costs. This is why, even with massive and increasing amounts of solar electricity getting dumped on the grid during the day, California electricity prices keep going up.
In California and nationally, electricity prices have moderated over the past year chiefly because of soaring natural gas production, which has reduced the price of natural gas domestically. The Biden–Harris Administration’s liquified natural gas (LNG) export ban has helped to add to domestic natural gas inventories in the U.S. market, further depressing natural gas prices.
The Claim that Renewables Are Cheaper than Fossil Fuels Ignores Multiple Costs. If renewable energy is so cheap, why is the U.S. spending more than $1.2 trillion subsidizing it over the next 10 years?
The “renewable energy is cheap claim” does not account for the cost (including added pollution) of specialized dispatchable power needed to stabilize the grid when renewable energy cannot satisfy demand during some parts of the day. Dispatchable power is power that can be ramped up or down as quickly as power needs require. The power plants capable of doing that are generally intermediate and peaker natural gas plants. The more efficient large-coal, nuclear, and combined-cycle natural gas plants are “baseload generators” and not generally dispatchable because their steam boilers require hours to ramp up. Dispatchable plants have lower efficiency and lower-capacity factors than larger baseload generators, which means that they have significantly more pollution and carbon emissions per unit of output than baseload generators. The claim also does not account for the cost of early decommissioning or leaving idle those baseload generators that could supply demand, nor the original capital costs of those baseload generators, which are still included in residential electricity bills.
Wind and solar power need utility-scale battery power to stabilize their intermittency. This is especially true in those scenarios that reject “net-zero” carbon emissions in favor of “absolute-zero” carbon emissions, dispensing with all sources of fossil power. The levelized cost of energy (LCOE) of solar power plus battery power is at a minimum twice the marginal cost of nuclear energy and combined-cycle natural gas and ranges as high as seven times more.
Solar and wind power have far lower capacity factors than coal and natural gas operating under normal conditions. When U.S. coal plants achieved their historical peak output in 2007, the capacity factor of coal plants was 75 percent. Since then the shale boom and climate policies, including the Inflation Reduction Act (IRA) subsidies, have combined to push down coal usage, so the capacity factor of coal dwindled to 42 percent in 2023. That is still better than solar power, which has an average capacity factor of 25 percent, varying widely from 31.1 percent in July to 13.7 percent in December.
This means that in the winter, one needs about 500 megawatts (MW) of solar capacity to replace 100 MW of coal.And eventhat is just an average, which glosses over the intermittency of solar power and other costs that have to be factored in; even at five times the capacity of retiring coal, solar power will not be available at critical times when needed to satisfy the “load” on the grid.
Proponents of renewable energy add up the maximum power output of all new solar plants being proposed as “proof” that renewables are coming to the rescue. But maximum power output is an irrelevant figure for an intermittent and unpredictable energy source. Grid operators need to know that they can power the entire grid when solar and wind farms are at their lowest output.
According to PJM Interconnection, which operates the grid in Pennsylvania and a dozen neighboring states, “renewable generation…represented as much as 118% of the RTO load…and as little as 3% of the RTO load.”
That means that even when the grid has 30 percent or 50 percent renewables, grid operators will still have to find enough non-renewable power to supply 97 percent of grid requirements.
Climate activists justify their renewable mandates by pointing to the nominal (that is, the theoretical maximum) output of planned renewable energy projects. They say that this nominal new renewable capacity exceeds the nominal capacity of the coal, natural gas, and nuclear plants that are being retired. But solar and wind power have far lower capacity factors than baseload generators like coal, natural gas, and nuclear energy, which means that the more solar and wind capacity a grid has, the lower the ratio of electrical output to nominal capacity on the grid.
The capacity factor (or accredited capacity) of the renewable additions is just a small fraction of the installed capacity (unlike the retiring baseload, whose accredited capacity is much higher). According to the Midcontinent Independent System Operator’s (MISO’s) own forecast, the accredited capacity of the overall grid declines at an accelerating rate the greater the penetration of renewable capacity. (See Chart 1.)
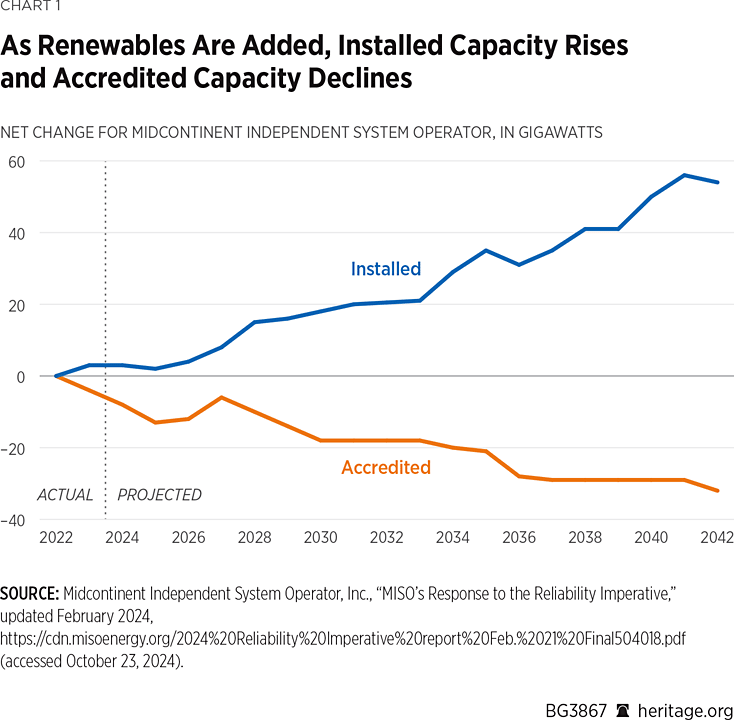
Moreover, even that accredited capacity is a yearly average. MISO accredits solar power at 50 percent of installed capacity spring, summer, and fall, but at only 5 percent of installed capacity in winter.
Even in summer, solar and wind routinely fall far short of their theoretical maximum generation capacity. For a snapshot of the fuel mix powering the MISO grid at 5:30 p.m. Central Time on August 27, 2024, see Chart 2.
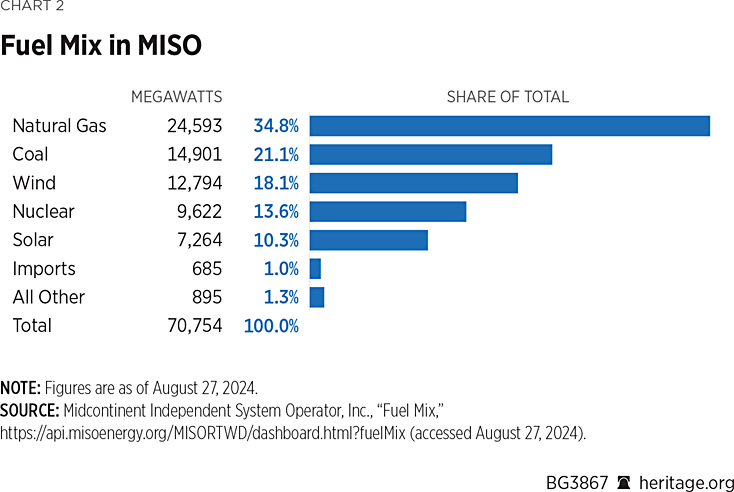
The fuel mix is a vivid demonstration of the importance of baseload generation. Natural gas, coal, and nuclear energy account for 97 gigawatts (GW) of MISO’s total generation of 112 GW at that hour. That is 87 percent of the electricity on the grid when there are still a few hours of daylight left in the Upper Midwest. Renewable capacity makes up just 4 percent of the mix at 5:30 p.m. By contrast, solar and wind power account for more than 25 percent of nominal “installed capacity” in MISO.
Federal Policies Are Forcing Retirements of Needed Generation Capacity in the Face of Soaring Demand Projections. The Environmental Protection Agency’s (EPA’s) power plant rule is shutting down coal and is freezing investment in new natural gas. The Biden–Harris Administration has promised to go after existing natural gas plants next. The EPA has already announced plans to impose a carbon rule on large existing natural gas plants. The Administration’s climate policies will bring catastrophic energy scarcity.
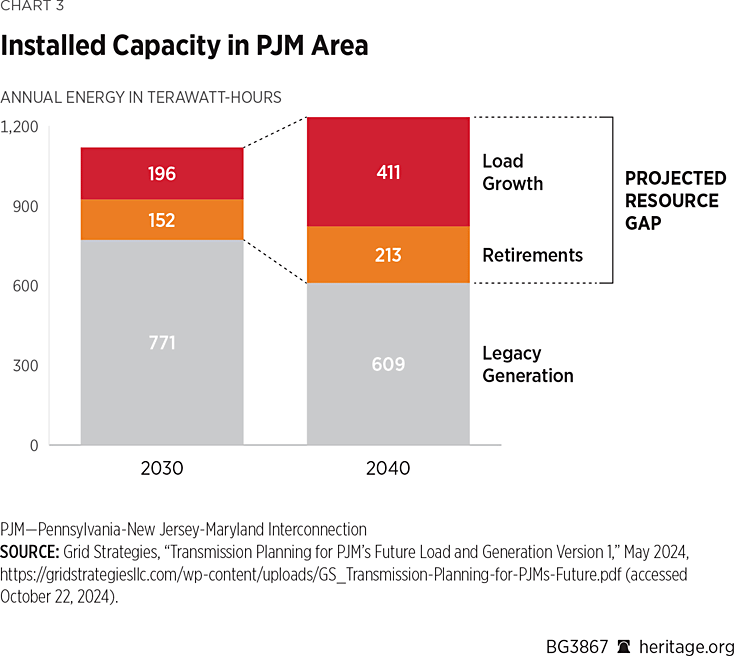
PJM is forecasting a massive wave of power plant closures, driven in part by the new EPA rule. According to PJM, up to 58 GW of coal and natural gas plants are at risk of closing by 2030. This figure represents more than 20 percent of PJM’s total power-generation capacity—equivalent to losing 58 average-size nuclear plants. Simultaneously, electricity demand in the PJM area could rise by 25 percent by 2040. (See Chart 3.)
“I think the PJM has a real crisis looming on its hands,” Pennsylvania State Senator Joe Pittman said recently. “I see no real reliable plan to replace the megawatts that are due to come offline in the next few short years.”
The combination of soaring demand and shrinking supply spells skyrocketing electricity prices and deadly blackouts for Pennsylvania and other states in the PJM area. Indeed, in a recent PJM capacity auction for 2025 and 2026, prices soared by a staggering 833 percent. As a direct result, Pennsylvanians’ electricity bills are expected to rise by perhaps 30 percent, but could rise much more. Capacity auction prices are about 10 percent of the typical electricity bill, but capacity prices rarely rise in isolation. A significant rise in capacity prices is a signal that demand is rising faster than capacity, and scarcity pricing could result. Electricity prices in the PJM area and other parts of the country could double in just a few years.
In a recent federal court filing, PJM and its sister RTOs warned that the new EPA rules are “not workable” and will force power plants to close at an even more rapid rate in the years ahead. In combination with other misguided federal policies, the EPA rule makes maintaining and building these plants prohibitively risky for investors. Proposals for large new coal and natural gas plants have virtually vanished in the PJM area. Financing for existing power plants is also at risk. In its court filing, PJM warns of “the chilling impact these collective rules will have on the investment required to retain and maintain existing generation units that are needed to provide key reliability attributes and grid services.”
PJM estimates that renewable energy projects in the “interconnection queue” have a completion rate of just 5 percent to 10 percent, far below the 50 percent to 60 percent that PJM’s CEO says would be needed to meet future demand.
MISO—Grid Operator in the Upper Midwest and Parts of the South—Has Similar Problems. In August 2024, 160,000 people were without power in Minnesota for almost a week. The proximate cause was bad weather, but the blackouts were a predictable result of Minnesota not investing enough in grid reliability. The outages came just a day after MISO issued a “Max Gen” alert to utilities, warning them to implement emergency measures to prevent rolling blackouts because capacity was about to start falling short of demand.
MISO has released a new report arguing that the reliability issues facing MISO are “urgent” and “complex.” John Bear, CEO of MISO, stated that there are “immediate and serious challenges to the reliability of our region’s electric grid, and the entire industry—utilities, states and MISO—must work together and move faster to address them.”
The renewable replacements that the Biden–Harris Administration keeps promising cannot fill the gap created by the retirement of reliable generation and are visibly falling short of what America’s electricity grid needs. And if the Administration and its leftwing allies seem unworried, it is because their Plan B—everyone on “energy welfare,” like in much of Europe—advances their socialist goals much better.
The IRA subsidies are fueling a tsunami of wind farms and even more solar farms. In the RTO/Independent System Operator (ISO) areas (which comprise most of the country except the Southeast and Western states outside California), utilities have to buy whatever power is cheapest at any given hour of the day. When heavily subsidized solar and wind power is being dumped on the grid, baseload generators cannot recoup their capital or operating costs. As a result, the interaction of the IRA subsidies with the RTO/ISO market structure is a toxic stew that is ending investment in the new baseload generators despite alarming signs that much more will be needed very soon.
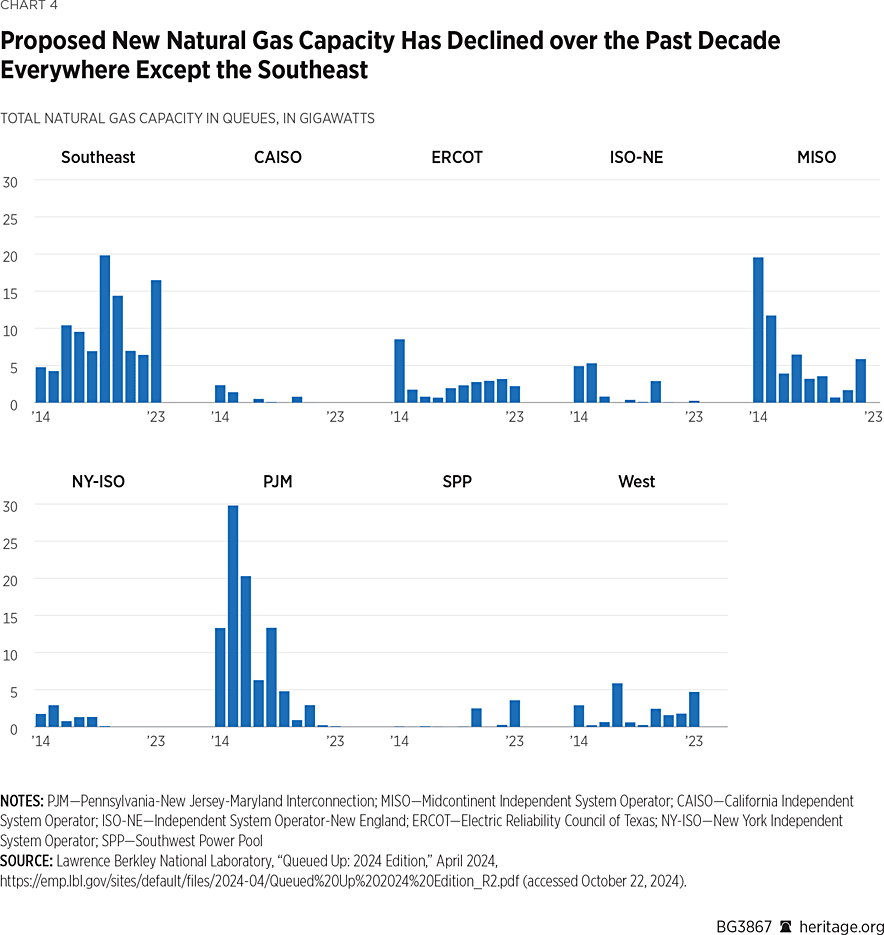
A brief look at the current interconnection queue shows alarming drops in new natural gas projects seeking interconnection to the grid—with one major exception which is the non-RTO/ISO Southeast. (See Chart 4, which shows significant continued interest in new natural gas plants only in the Southeast). In non-ISO areas, there are still vertically integrated utilities, which can pass on capital and operating costs to ratepayers. That still means higher prices for customers, but at least these areas will be shielded from the worst of the catastrophic shortfalls facing the MISO, PJM, and other RTO/ISO areas. In the face of soaring forecasts of the power that will be needed in the years ahead in the MISO and PJM areas and other RTO/ISOs, applications for new baseload plants have virtually vanished.
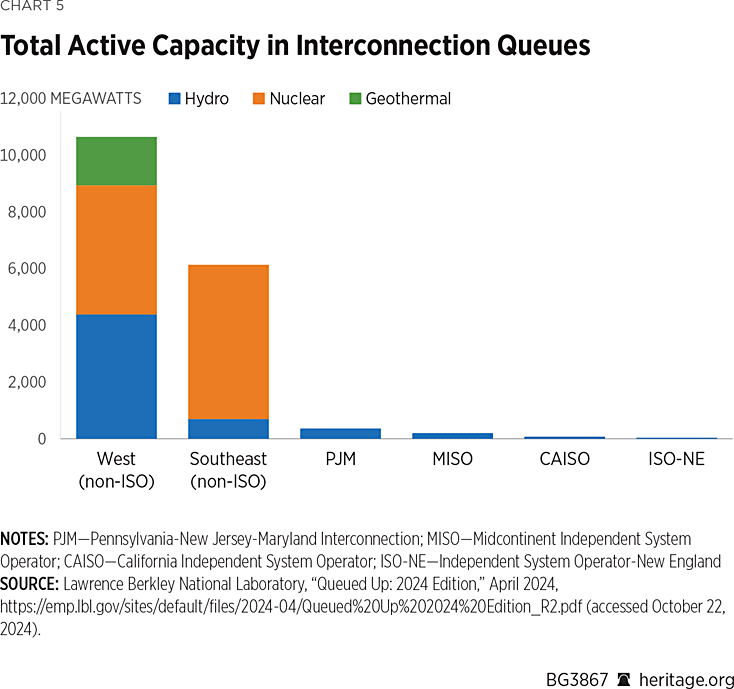
The “interconnection queue” shows the aggregate nominal capacity of electricity projects actively seeking interconnection with the electricity grid (“active capacity in queues”). Chart 5 shows the toxic effect of IRA subsidies in the RTO/ISO areas. There is not a single nuclear plant proposal seeking interconnection in any RTO/ISO area. Only in non-ISO areas where utilities are vertically integrated monopolies are there even preliminary proposals for nuclear seeking interconnection.
The IRA provides significant operating subsidies for nuclear plants. But these subsidies are too uncertain, and nuclear energy is currently too expensive, to give investors confidence that costs can be recouped.
The combination of misguided federal and state climate policies is causing vitally needed power plants to shut down at an increasing rate.
Coal. Substantial U.S. coal-fired capacity was retired over the past decade, and a record 14.9 GW was retired in 2015. Annual coal retirements averaged 11.0 GW a year from 2015 to 2020, decreased to 5.6 GW in 2021, and then increased to 11.5 GW in 2022. Twenty-two coal plants were retired in 2022, and the capacity retirement was 11.5 GW.
Natural Gas. This year, 6.2 GW of U.S. natural gas–fired capacity is scheduled to retire, representing 1.3 percent of the operating natural gas fleet as of January. Most of the retiring natural gas capacity is made up of older steam and combustion turbine units, which produce electricity less efficiently than many of the newer combined-cycle natural gas units.
Three aging natural gas–fired plants in California (Alamitos, Huntington Beach, and Redondo Beach), with a combined 2.2 GW of capacity, are scheduled to retire by the end of this year. These plants were originally slated to retire in 2020; they were granted a three-year extension to maintain grid reliability.
For All Their Costs, Climate Policies Will Have No Measurable Climate Benefit
The policies described in this Backgrounder entail costs far beyond what society would knowingly consent to, especially given that implementing them all would have virtually no measurable effect on global temperatures. Prior Heritage Foundation research based on government models has indicated that even complete elimination of CO2 emissions from industrialized countries will have no measurable effect on the climate. In particular, Heritage analysis has indicated that if the United States were to eliminate all CO2 emissions from fossil fuels, the measurable effect would be would less than 0.23 degrees C. If the European Union were to pursue similar policies, the measurable effect would be less than 0.13 degrees C.
Ultimately, even though these policies are geared toward altering climate change, they will have no measurable influence in doing so.
Conclusion
The growing divergence in electricity rates among U.S. states highlights the critical need for sensible energy policies that put people first. All the climate policies proposed to date would have no measurable influence on temperatures. The effect of these decisions will be felt not only in household electricity bills but also in the stability and reliability of the national power grid. Policymakers must carefully consider the trade-offs involved in pursuing aggressive climate goals while ensuring that energy remains accessible and dependable for all Americans.
Mario Loyola is Senior Research Fellow for Environmental Policy and Regulation in the Center for Energy, Climate, and Environment at The Heritage Foundation. Kevin D. Dayaratna, PhD, is Chief Statistician, Data Scientist, and Senior Research Fellow in the Center for Data Analysis at The Heritage Foundation. Andrew Weiss is Research Assistant in Domestic Policy at The Heritage Foundation.
Reprinted with permission from The Heritage Foundation – By Mario Loyola, Kevin D. Dayaratna, and Andrew Weiss
The opinions expressed by columnists are their own and do not necessarily represent the views of AMAC or AMAC Action.


Fear and ignorance go hand in hand, especially when it’s agenda driven. When was the last new power plant built to supplement all those aging ones being shut down? The government’s bureaucratic arm to mandate draconian change without any improvement is their constant inability to mismanage yet another national infrastructure. Here in California, solar is everywhere and yet during high demand days it’s the same song, cut back or else. That else is higher costs and power outages. In the meantime, government decided the only utility that actually lowers the electric grid demands, natural gas be eliminated. Are only politicians and bureaucrats that stupid to eliminate something before there’s a viable replacement?